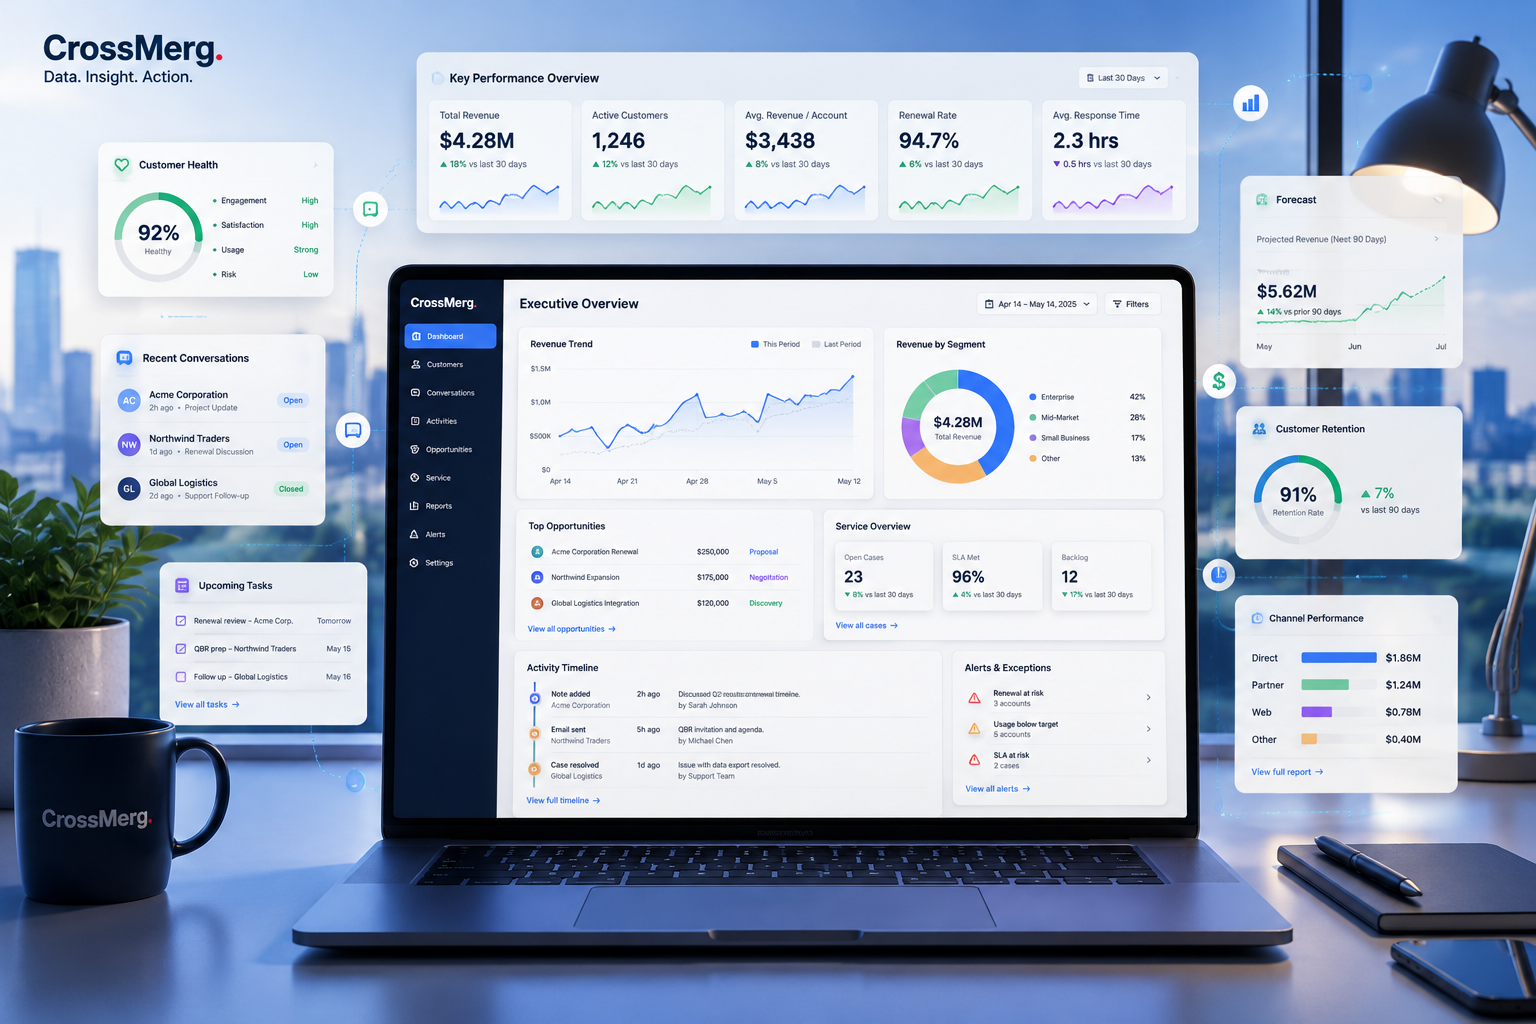
Important numbers come from different places
Sales, customer activity, projects, billing, service, and operational information live in separate tools or spreadsheets.
Visibility • Metrics • Trends • Forecasts • Decisions
CrossMerg turns operational and customer data into clearer reporting, useful performance signals, emerging trends, and decision-ready business intelligence—without burying your team in more dashboards.
When business data becomes hard to trust
Reporting becomes useful when people can understand where a number came from, what it means, how it compares, and whether it requires action.
Sales, customer activity, projects, billing, service, and operational information live in separate tools or spreadsheets.
A chart may show that something changed, but not what caused the change, who owns it, or whether action is required.
Different people use different filters, date ranges, definitions, or spreadsheet formulas for the same business measure.
Manual exports and recurring spreadsheet work mean problems are discovered days or weeks after they started.
Overall performance can look acceptable while specific customers, projects, opportunities, or service issues are quietly falling behind.
Reports accumulate, but priorities are still decided through instinct, lengthy meetings, or one-off analysis.
Create a reliable reporting foundation
CrossMerg connects useful reporting to clear definitions, dependable source records, understandable calculations, and the people responsible for acting on the result.
Start with the decisions the team actually needs to make—not with every field the system can report.
Determine which CRM, sales, service, project, billing, and operational records support each question.
Align statuses, date ranges, ownership rules, filters, and KPI definitions so people are measuring the same thing.
Compare important totals and samples against trusted source records before the numbers become decision inputs.
Give executives, managers, and operational teams the level of detail each role needs without unnecessary clutter.
Make ownership, calculation rules, refresh timing, and future changes understandable instead of creating another black box.
From raw data to useful insight
A useful intelligence workflow preserves the path from the original activity to the final business action so people can understand both the number and the reason it matters.
Record the customer, sales, service, project, financial, and operational activity that matters.
Put the data into consistent structures, ownership models, dates, stages, and categories.
Check completeness, definitions, relationships, and calculation logic before trusting the output.
Turn business activity into focused KPIs, counts, rates, timing, values, and operating signals.
Evaluate performance across periods, teams, stages, customer groups, targets, or expected ranges.
Add context so people understand what changed, why it may matter, and what deserves investigation.
Turn the insight into a practical next step, owner, priority, conversation, or operating decision.
Dashboards & operational visibility
CrossMerg brings the right operational signals together so leaders and teams can see movement, exceptions, ownership, and priorities without turning every decision into a reporting project.
See the measures that changed, the direction of travel, and whether performance is improving, stable, or falling behind.
Trend + varianceSurface overdue work, stalled opportunities, service issues, unusual changes, and results outside expected ranges.
Risk + alertsConnect the number to the responsible team, customer owner, project lead, salesperson, or operational role.
Owner + statusRank the few items that deserve action instead of forcing people to scan every chart, record, and report.
Priority + actionUse visual hierarchy, thresholds, ownership, and comparison so the dashboard naturally points toward the next useful question.
Operational visibility principle
KPI & performance tracking
Useful performance tracking connects the current result to a target, a meaningful variance, recent movement, ownership, and enough context to decide whether the change deserves attention.
$450K target
4.0× target
93% target
< 3 hrs target
A complete performance signal
Define the expected result, acceptable range, or threshold so performance has a reference point.
Show the current result using the same definition, date range, and data source as the target.
Make the gap visible in practical terms—percentage, points, value, time, count, or rate.
Add movement over time so people can distinguish a one-time result from a developing pattern.
Connect the measure to a responsible person, team, process, account, or operational area.
Explain why the number matters and what question should be asked when it moves outside the expected range.
From metric to management signal
That combination makes it much easier to separate routine fluctuation from a real business issue, opportunity, or change in direction.
Trends, exceptions & early warning signals
CrossMerg helps surface movement, aging, thresholds, exceptions, and combined indicators so teams can investigate emerging risk or opportunity while there is still time to respond.
Down from 38.9% over the last three reporting periods.
Review stage conversion and lost-opportunity reasons.
Seven items have remained unresolved for more than five business days.
Review ownership, blockers, and escalation path.
Accounts combine low activity, open issues, or declining engagement signals.
Prioritize account review and retention outreach.
Qualified expansion opportunities are increasing faster than the prior quarter.
Validate capacity and prioritize high-fit accounts.
Build signals that deserve attention
Compare enough periods to distinguish a real direction from normal fluctuation.
Define when a result moves outside an acceptable range so attention is triggered consistently.
Track how long work, opportunities, issues, or customer conditions remain unresolved.
Surface the small number of records or segments behaving differently from the overall average.
Use multiple weak indicators together when no single metric is strong enough to explain risk or opportunity.
Connect each signal to the question, owner, review, or workflow that should happen next.
Signal discipline
The goal is not constant notification. It is earlier visibility into the few changes that may affect revenue, customers, delivery, service, capacity, or operating performance.
Forecasting & decision support
CrossMerg combines current business conditions, historical behavior, known commitments, assumptions, and scenario ranges so teams can make forward-looking decisions with clearer context.
Scenario outlook
$1.74M – $1.91M
Current pipeline, conversion, delivery capacity, and known renewal activity continue near recent performance.
$1.96M – $2.12M
Conversion improves, expansion activity holds, and delayed opportunities close inside the forecast window.
$1.48M – $1.66M
Several large opportunities slip, renewal risk increases, or capacity constraints reduce expected throughput.
Decision question
Build a forecast people can understand
Use prior conversion, timing, retention, demand, workload, and delivery patterns as context—not as a guarantee.
Include booked work, open opportunities, renewals, contracts, backlog, known capacity, and other current-state facts.
Make expected changes explicit so the forecast can be challenged, adjusted, and understood by decision makers.
Compare likely, upside, and downside paths rather than forcing one precise number to represent an uncertain future.
Update the outlook as actual results, timing, capacity, customer behavior, and risks change.
Tie the forecast to a real choice such as hiring, spending, capacity, pipeline focus, retention effort, or delivery planning.
Forecasting principle
A useful forecast gives leaders enough direction to adjust capacity, spending, pipeline focus, customer attention, or operating plans as new information arrives.
Customer, sales & service intelligence
CrossMerg helps connect customer health, revenue movement, service conditions, and delivery performance so teams can see how one part of the business may be affecting another.
Combine engagement, support activity, delivery history, open issues, account value, and recent changes so teams can recognize healthy, growing, or at-risk relationships.
Connect pipeline movement, conversion, deal aging, source performance, expected revenue, and closed outcomes so leadership can focus on the parts of the revenue engine that need attention.
Bring together workload, response time, completion pace, backlog, handoffs, capacity, and customer-facing service conditions to make delivery performance easier to manage.
Connected intelligence view
Qualified opportunities are taking longer to move between stages.
Open work is remaining unresolved longer than the expected range.
Several higher-value accounts show lower engagement plus open service issues.
Healthy accounts with strong usage and recent growth are entering an expansion window.
Connected intelligence principle
That cross-functional context helps leadership distinguish isolated events from broader patterns affecting customers, revenue, delivery, capacity, and growth.
Practical business outcomes
CrossMerg helps reduce reporting friction, improve operational focus, and give leaders a clearer basis for deciding where to investigate, intervene, invest, or adjust.
Reduce the time spent gathering, reconciling, and debating numbers so leadership can focus on what the information means.
Recognize customer risk, delivery delays, stalled pipeline, or operating pressure before the issue becomes harder to correct.
Connect important metrics and exceptions to the team, role, customer owner, project lead, or process responsible for the next move.
Use current conditions, historical behavior, scenario ranges, and visible assumptions to plan around uncertainty more effectively.
See relationship health, open issues, engagement, renewal risk, and expansion potential in context with service and revenue activity.
Reduce recurring exports, spreadsheet assembly, one-off calculations, and repetitive reporting preparation where the data can be structured once.
From reporting friction to decision support
Reports assembled manually
Decision-ready reporting structure
Metrics reviewed in isolation
Connected context across teams
Problems discovered after the fact
Earlier signals and exceptions
One forecast treated as certainty
Scenario ranges and assumptions
Meetings debate which number is right
Shared definitions and trusted logic
Dashboards show everything
Views prioritize what deserves attention
Reporting & BI outcome
That is the difference between collecting business data and actually using it to manage the business.
Questions before you start
Reporting & Business Intelligence is most useful when the underlying question is about visibility, performance, trends, exceptions, forecasting, or decision support. This guide helps separate that need from adjacent CrossMerg services.
Service decision guide
You need clearer visibility into performance, trends, exceptions, forecasts, or decision support.
You first need the CRM structure, fields, stages, records, permissions, and configuration built correctly.
You already understand what should happen and need work to move automatically between people, systems, or steps.
You need a clearer ongoing view of customer history, communication, ownership, engagement, service, and retention.
Frequently asked questions
If your situation crosses more than one service area, that is normal. We can start with the business question and determine which foundation or improvement should come first.
Not necessarily. We begin with the systems and data you already use. In many cases, the first improvement is better structure, definitions, connections, or reporting logic rather than replacing the underlying tools.
Yes. Executives, managers, sales teams, service teams, and operational staff often need different levels of detail. The goal is to give each role the information needed for its decisions without forcing everyone into the same dashboard.
We start with the business questions and decisions that matter. From there, we identify the measures that explain performance, expose risk, support accountability, or indicate whether action is needed. We avoid adding metrics simply because they are easy to calculate.
That is common. Reporting work can include reviewing definitions, statuses, ownership, date logic, missing fields, duplicate records, and other quality issues. Important reporting should be validated before it becomes a trusted management input.
Yes, where the underlying data supports it. We can define thresholds, aging rules, status conditions, trend changes, or combined indicators that make important exceptions easier to surface. The emphasis is on meaningful signals rather than excessive alerts.
Yes. Forecasting can combine current commitments, historical behavior, pipeline or customer activity, capacity, assumptions, and scenario ranges. We treat forecasts as planning tools that should be updated as actual conditions change.
Often, yes. The right approach depends on the systems, available integrations or exports, data quality, refresh needs, and the decisions the combined information is intended to support. We prefer the simplest dependable connection that meets the reporting need.
It can be either. Some businesses need an initial reporting foundation and dashboard build, while others benefit from ongoing refinement as metrics, workflows, customer behavior, or leadership priorities change.
Turn business information into clearer decisions
We’ll review where reporting, metrics, trends, exceptions, forecasting, and operational visibility are currently disconnected and recommend a practical way to make the information easier to trust, understand, and act on.
Why businesses trust CrossMerg
We help teams improve the client experience without adding unnecessary complexity, forcing a large migration, or losing sight of how the business actually works.
Practical value
Founder perspective
How we work
Client-first language
We translate internal workflow into simple client-facing steps that reduce friction.
Lightweight rollout
Start with one feature before rolling out deeper portal options.
Works with your reality
We respect your team size, tools, and capacity — no forced big-bang migrations.